Heart Sense
Understanding Our Individual and Collective Selves: A Design-based Inquiry into the Physiology of Embodiment


How can the very creation, rendering, and experiencing of biological data be distinctly feminist? For example, how can it start from women’s lives in all our plurality and complexity, break down binaries such as objectivity/subjectivity and science/feminism, and contribute to a more nuanced understanding of our bodies – a kind of knowing that is in and of the world?
Heart rate data may seem like a counterintuitive choice as an entry point into these questions. The monitored heart rate can be very mechanistic and even disciplinary: the persistent mechanical beeping during surgery (Kneebone, 2017), the fetal heartbeat of anti-choice politics (Edgar, 2017), monitors that can spur excessive intervention in childbirth (Cartwright, 1998), and even fitness monitors that incite increased intensity in exercise (Pirkko & Pringle, 2006: 59). Heart rate can be a site of plural layers of “control by quantification” (Browne, 2015: 9). Yet the heart remains ambiguous and undisciplined. In times of emotional intensity, a racing heart rate can feel very much out of control. At the same time, we can feel our own heartbeat, and that of others with whom we are intimate. In this manner, heart rate offers an accessible route into engaging with our bodies. This mundaneness and accessibility, in turn, makes it less likely that data about the heart could mechanize subjectivity the way that data about, say, the brain might. The heart’s pace is at once most intimate and personal, while simultaneously deeply connected to others and the outside world. Creatively engaged, heart rate can offer an intriguing point of departure for feminist engagement with the entangled nature of data, matter, and meaning both in theory and practice.
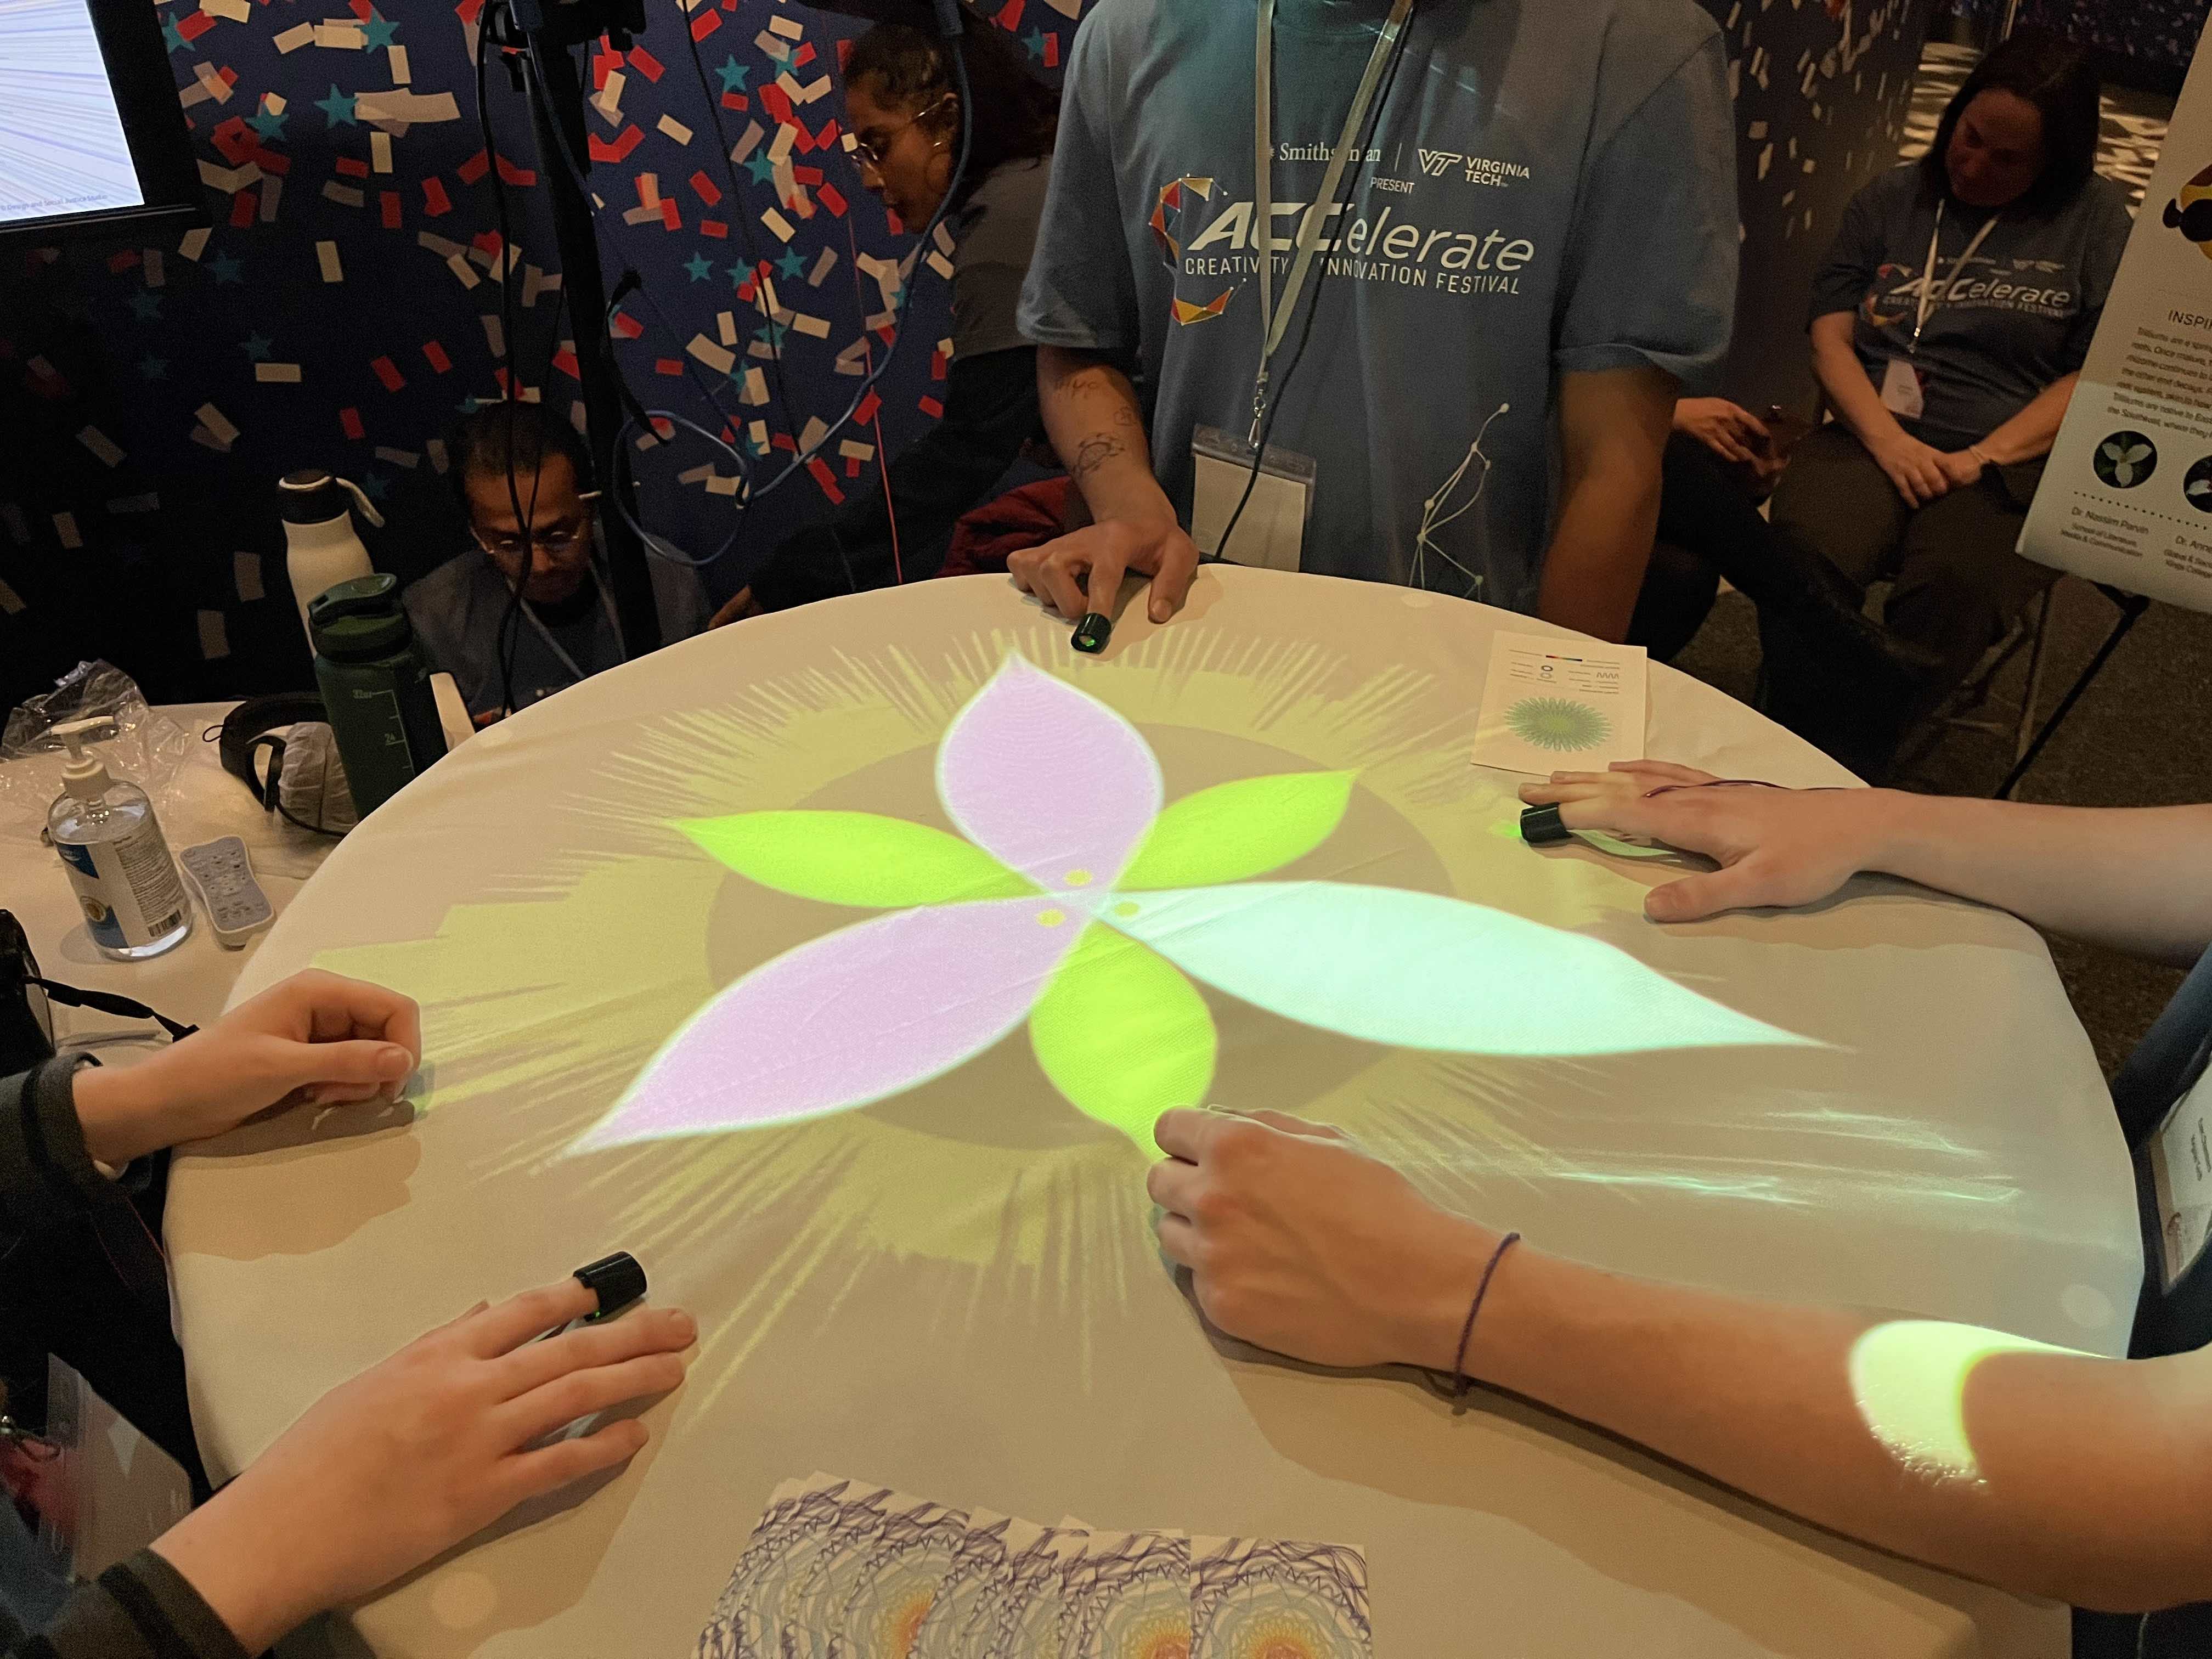
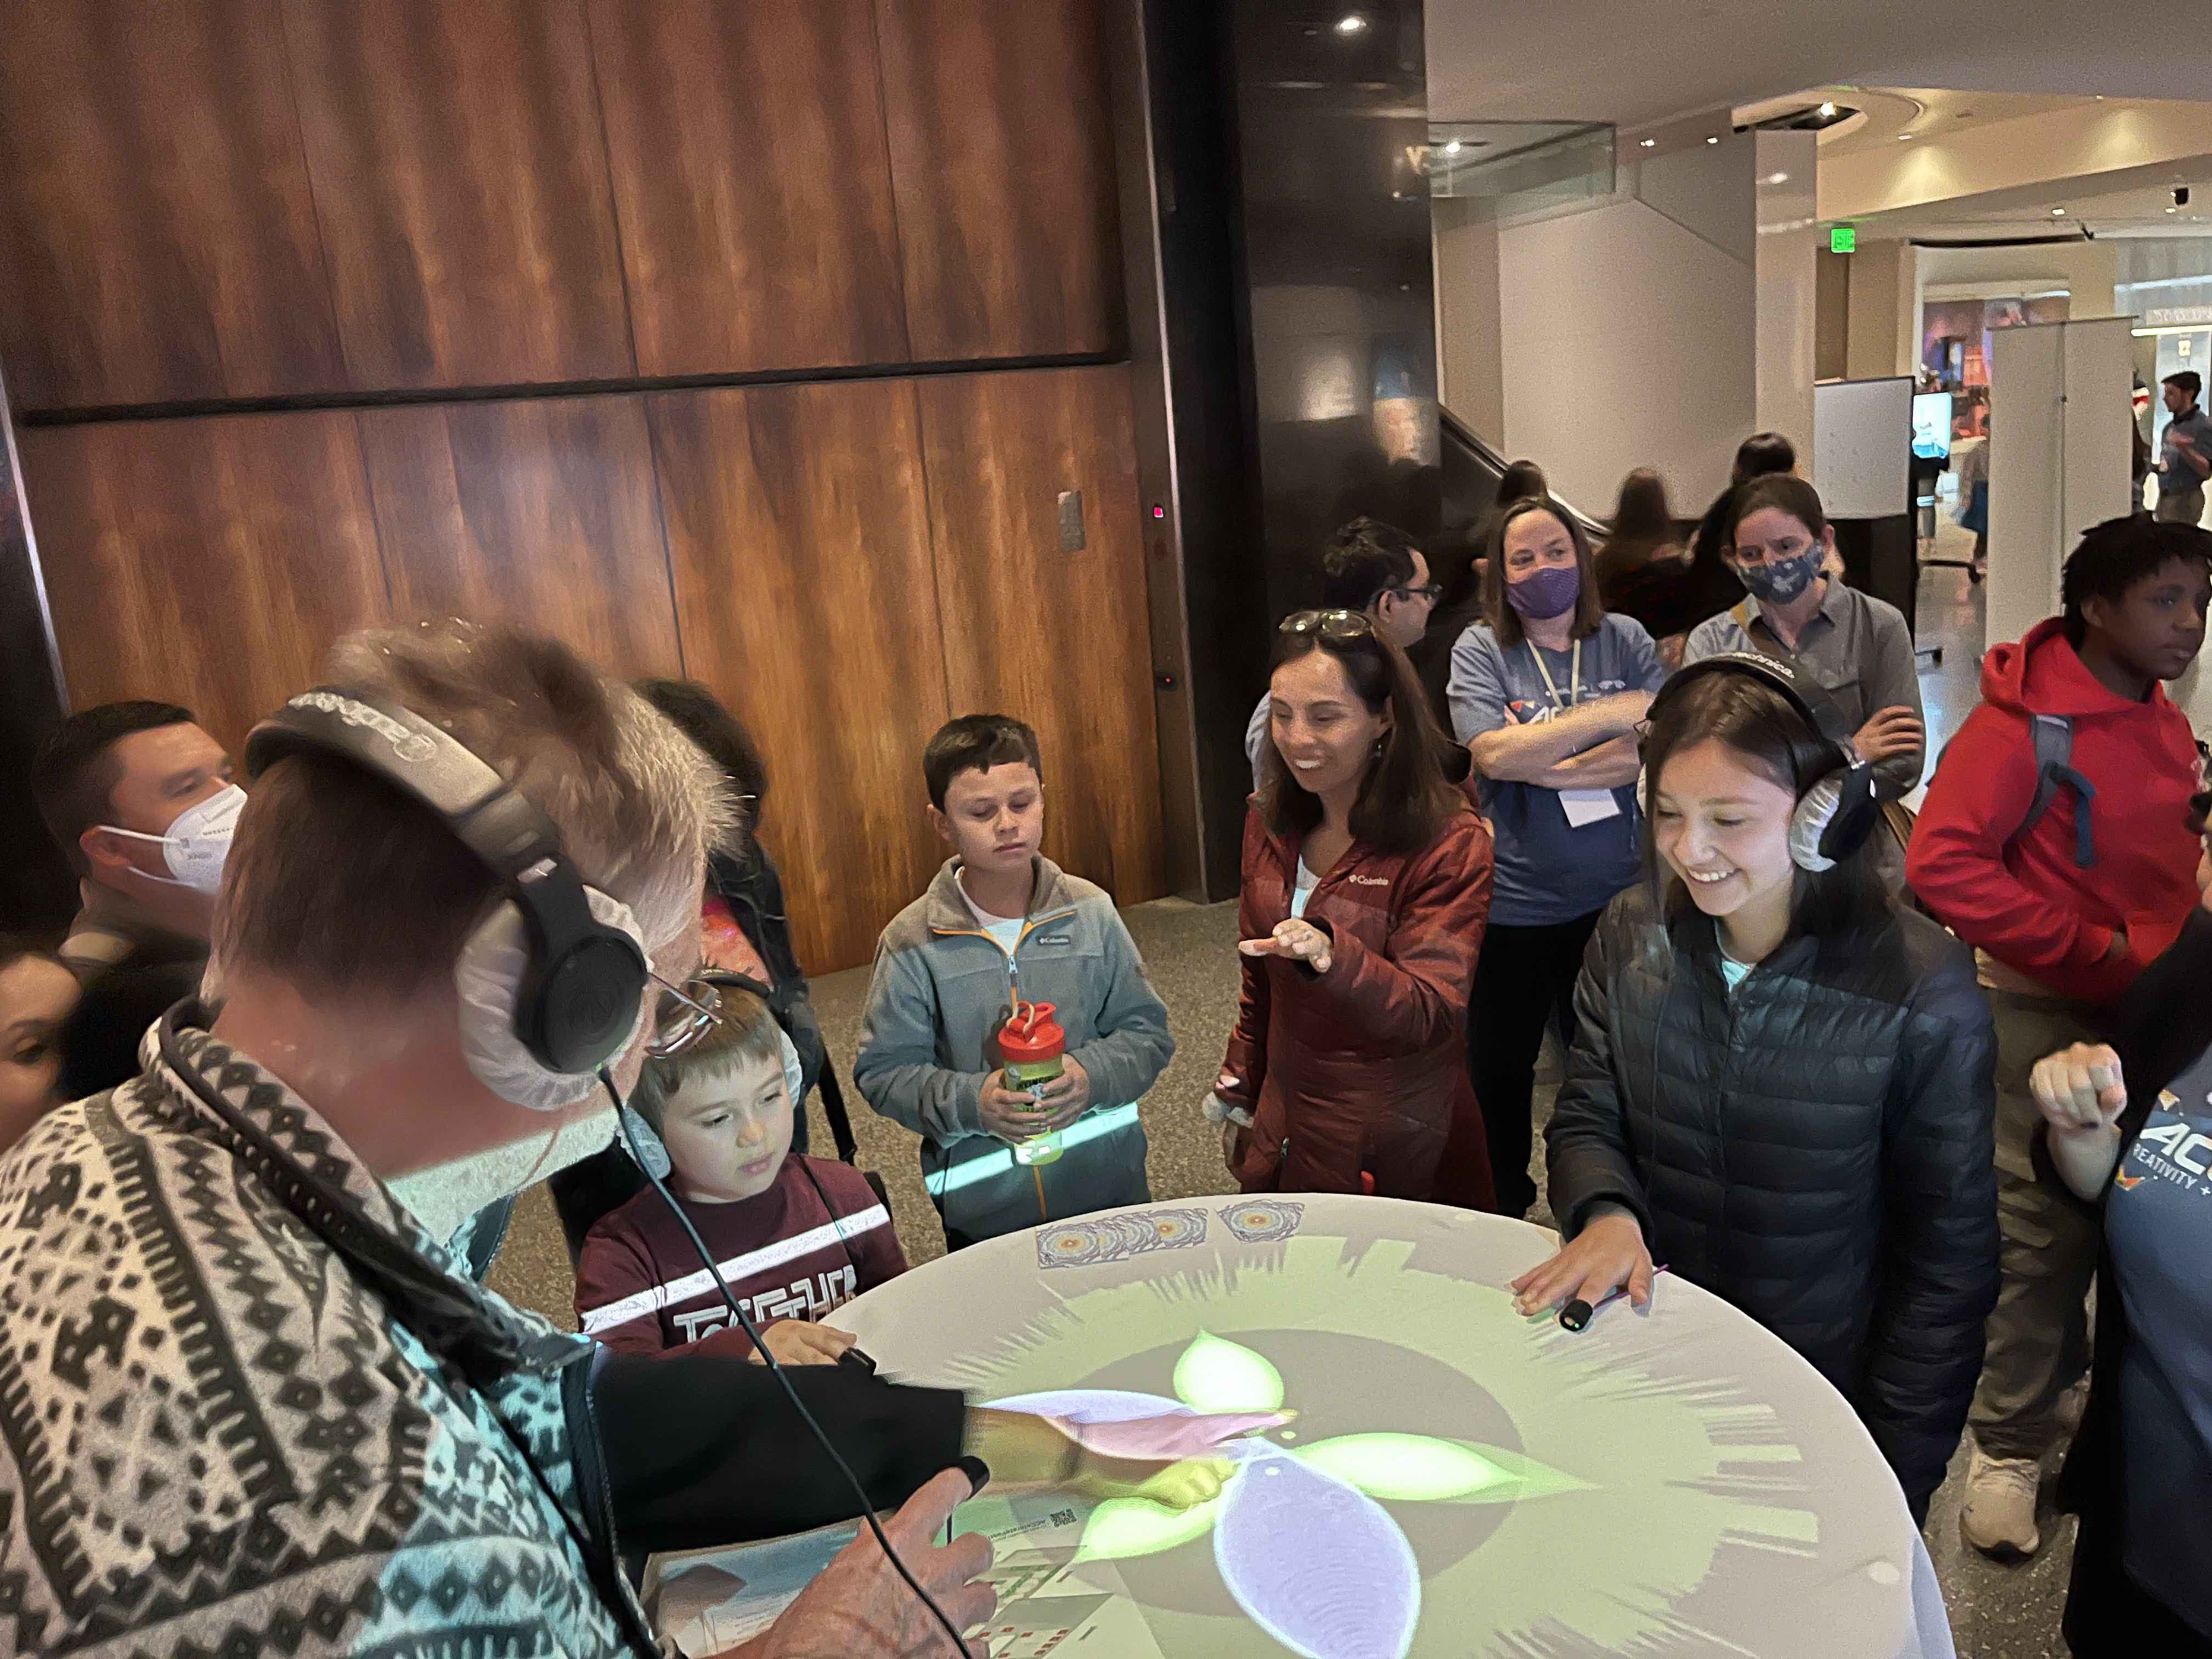
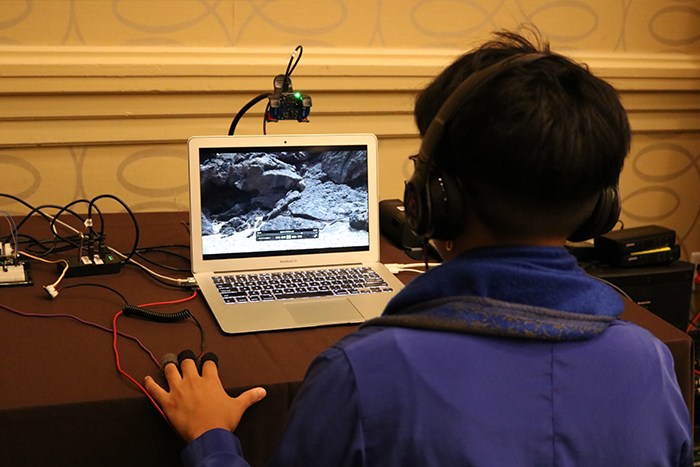
This installation engages with social dimensions of embodiment through the mediation of the physical environment. Three participants are invited to sit around a table and are given headphones to listen to music. A floral visualization representing both individual and collective heart rates of the participants will be projected onto the table, the size and the colors of each petal shifting with changes in each participant’s body. The visualization showcases how our bodies come into relation with each other and are in and of the environment, as they respond to our surrounding conditions even when we are not aware of it. The floral form takes inspiration from the trillium, a spring ephemeral whose individual flowering bodies are connected by a system of underground rhizome roots.
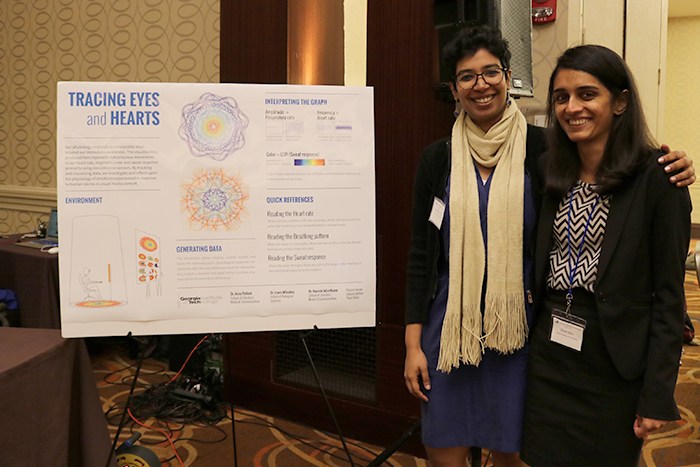
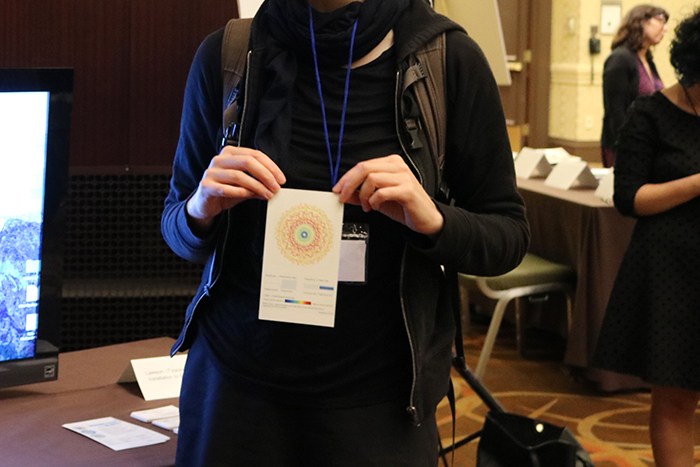
This installation takes a participant’s heart rate, galvanic skin response, and breathing as input to produce flower-like visualizations that illustrate physiological responses to a short, emotionally engaging video. The visualizations work eschew standard body tracking visualisations by presenting representations that are whole and designed not to be optimizable. They give participants a sense of their embodied responses to the video and a chance to reflect on their embodied responses in the process. Each heart visualization displays a person's physiological response to watching an emotionally-engaging video. Different physiological characteristics (heart rate, galvanic skin response, and breathing patterns) were used as variables to create a flower-like visualization.
[1] Nassim JafariNaimi and Anne Pollock, "Heart Sense: Experiments in Design as a Catalyst for Feminist Reflections on Embodiment," in Proceedings of 2018 Design Research Society (DRS) Conference, (Limerick, Ireland: 2018): Vol 2., 497–505. Download Here.
[2] Nassim JafariNaimi and Anne Pollock, “Heart Time: Reflections on Physiology and Embodiment.” 2017 Meeting of the Society for Literature, Science and the Arts (SLSA), November 2017 (Tempe, Arizona).
[3] Pollock, Anne. Heart feminism. Catalyst: Feminism, Theory, Technoscience 1, no. 1 (2015).
[4] Cox, Olivia. (2021) Anticipating Explicit Motor Learning by Assessing Arousal Levels using HRV and GSR [Undergraduate Thesis, Georgia Institute of Technology].
We have presented this work at:
Time can also play a factor in our heart rate. Below is a visual prototype of how to visualize our heart rate against time. On the left is a clock, ticking by as the seconds pass by. On the right, a heart rate is displayed. The difference between the seconds passing and the heart rate is depicted using color. As the heart rate moves closer to seconds passing, the color of the number will change to blue.

Wave showing beat of music
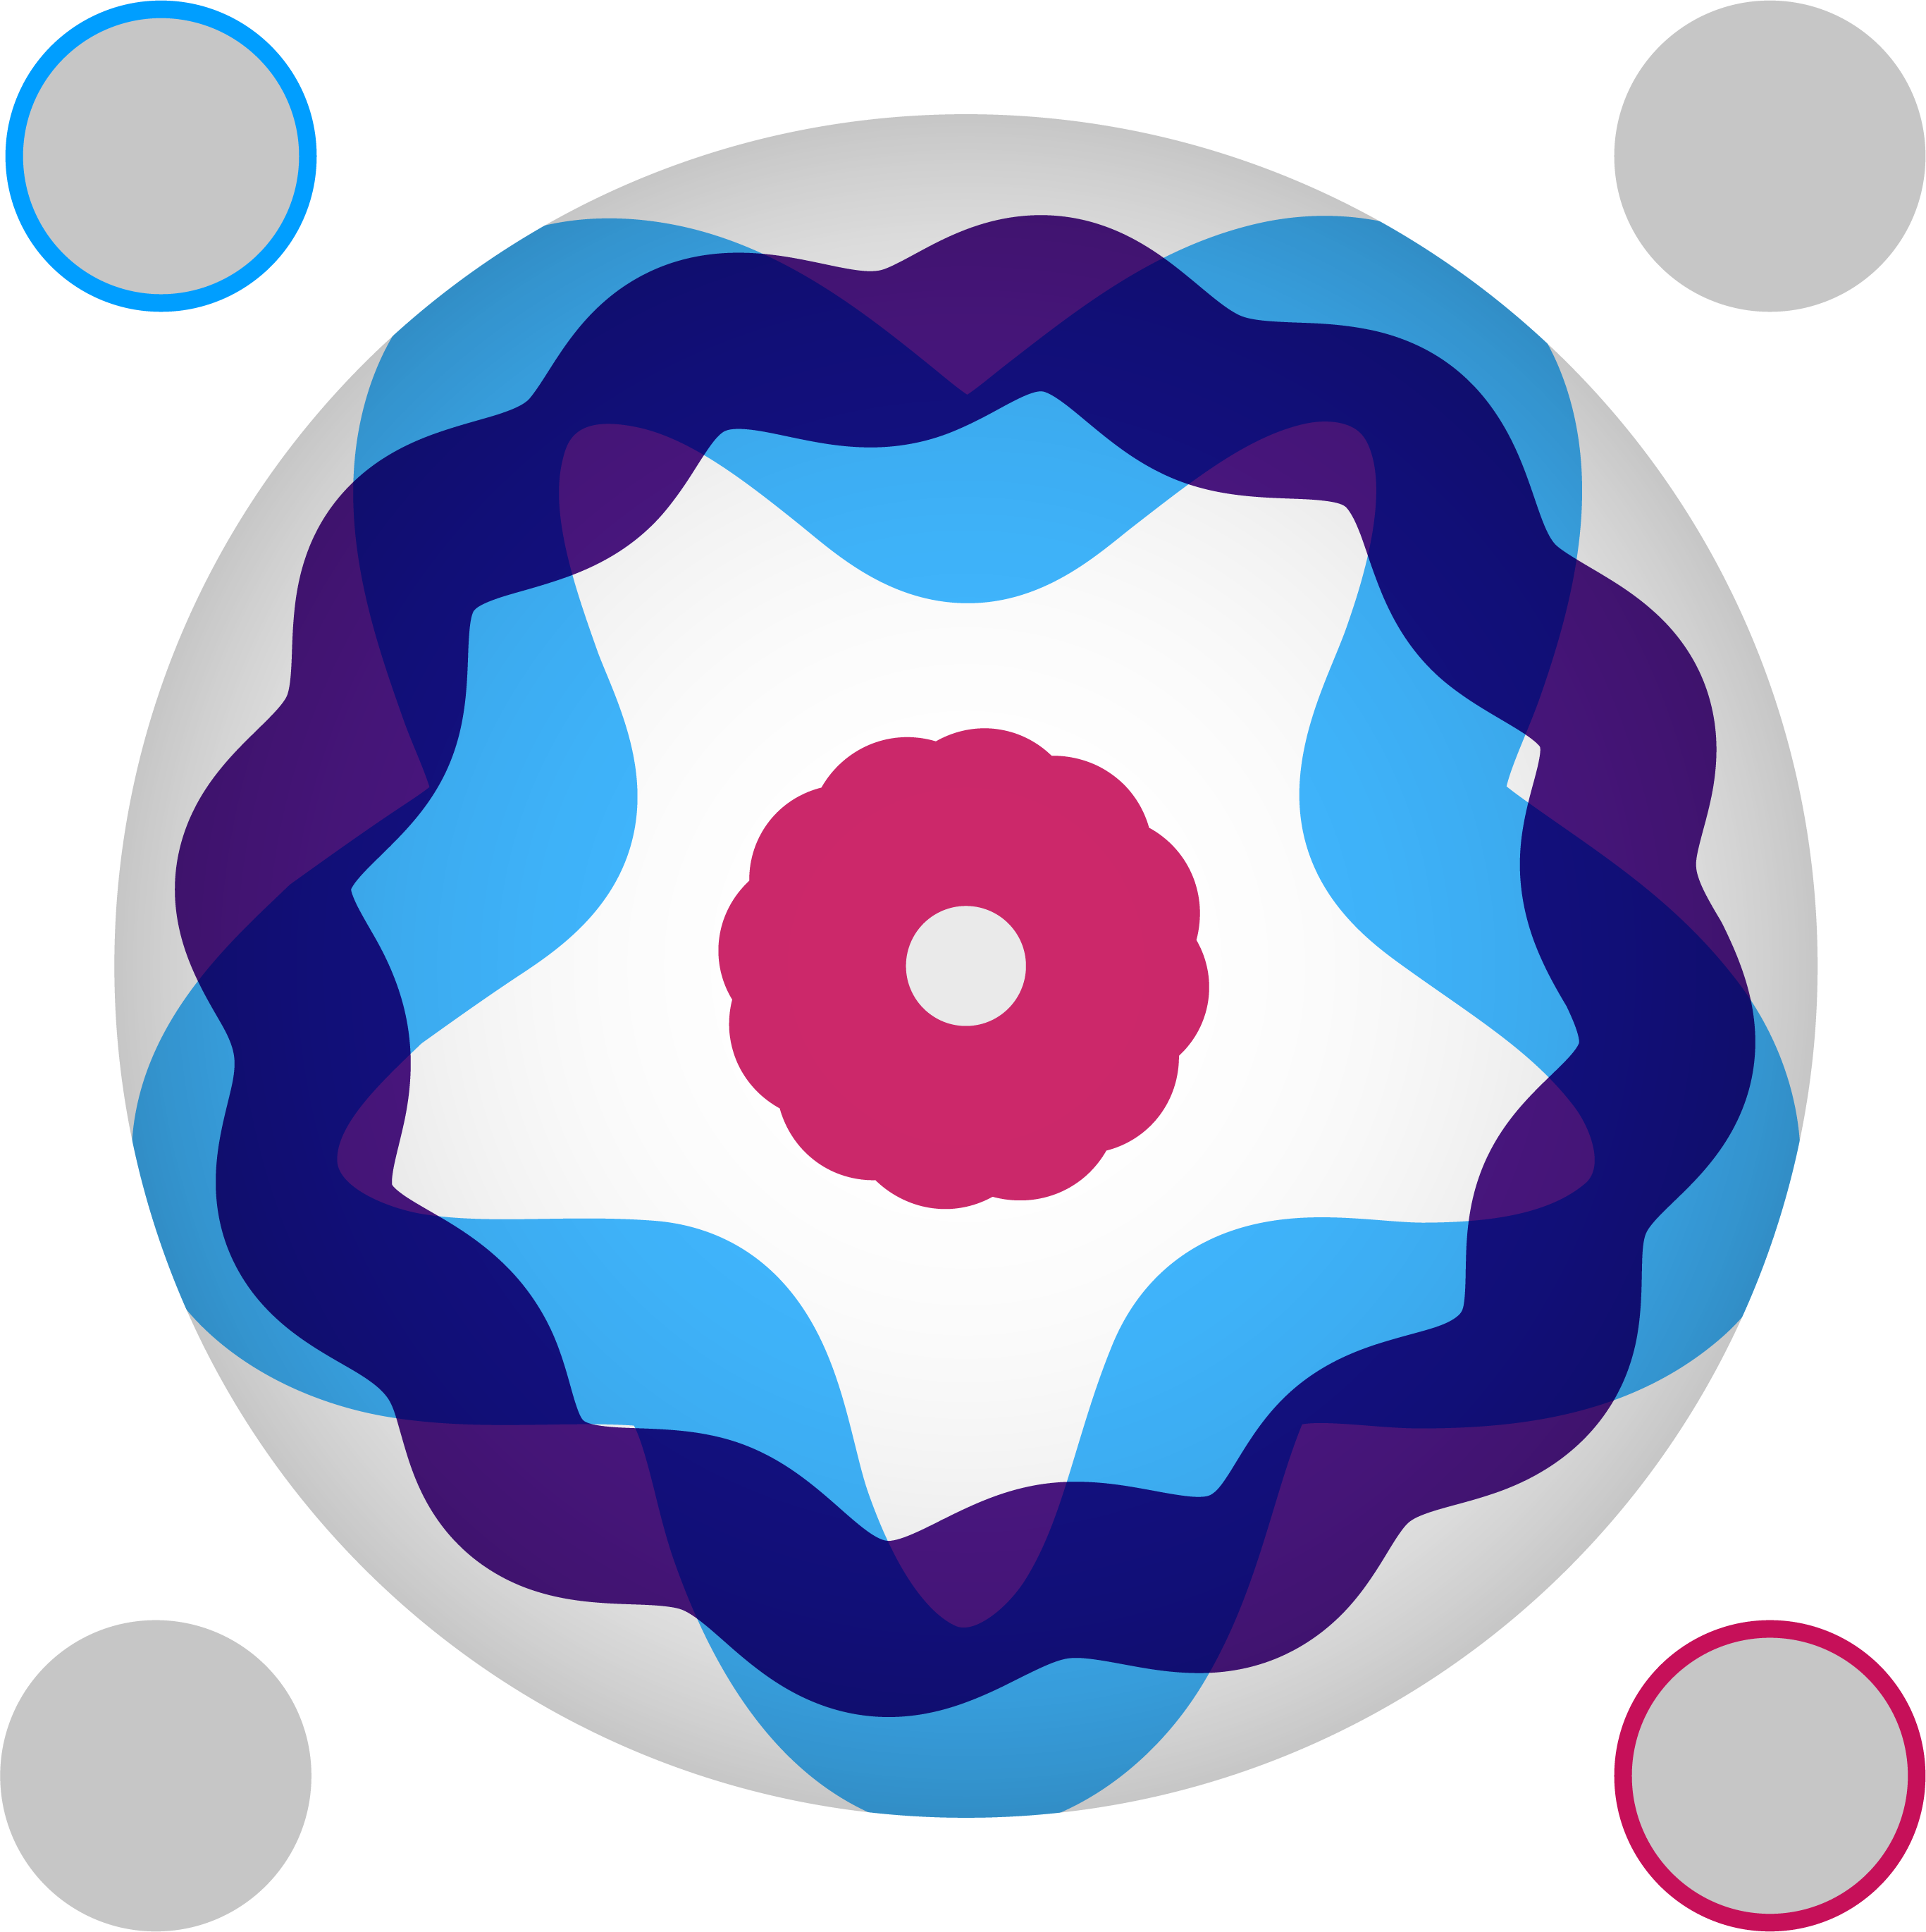
Wave with 2 additional people, displaying their heartbeats

Wave with 4 people, displaying all heartbeats
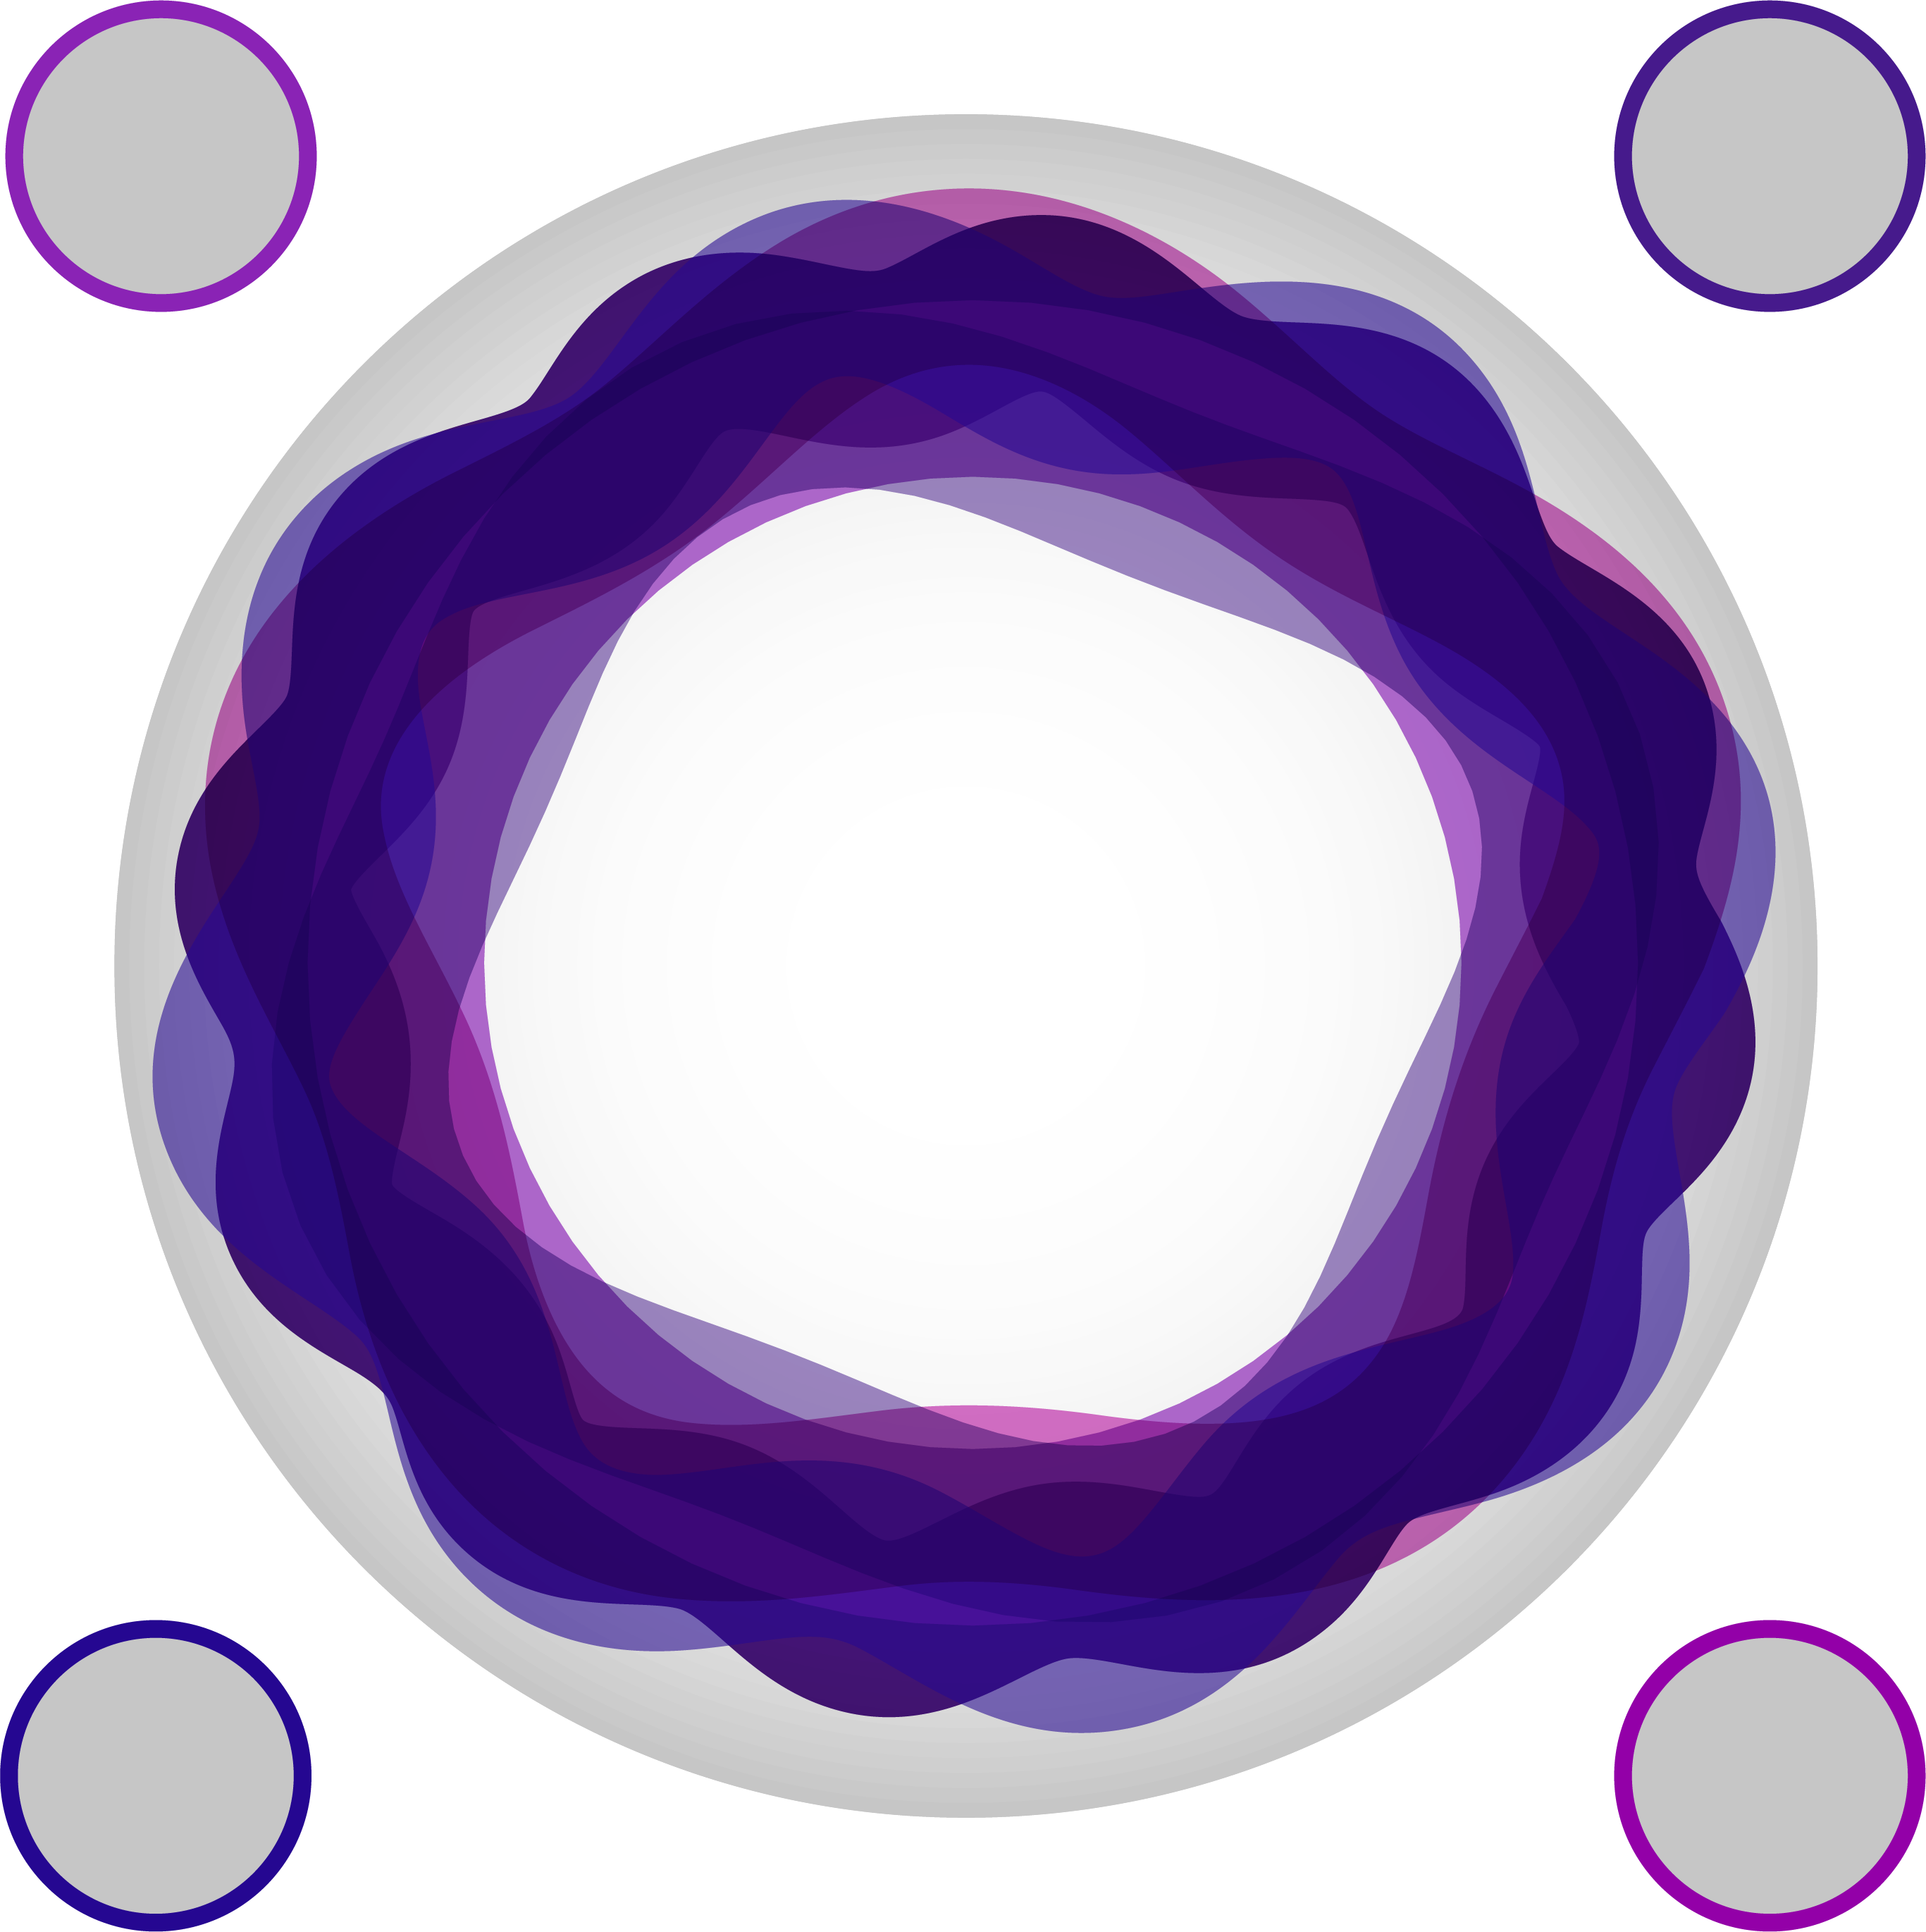
All waves syncing closer with the music

Sylvia Janicki
Digital Media, PhD Student

Aditya Anupam
Digital Media, Postdoctoral Researcher

Shubhangi Gupta
Digital Media, PhD Student

Mohsin Y. K. Yousufi
Digital Media, PhD Student

Pooja Casula
Digital Media, PhD Student

Michelle Ramirez
Digital Media, MS Student
Christina Bui
Digital Media, MS Student

Tae Prasongpongchai
HCI, MS Student

Charlie Denton
Digital Media, MS Student

Olivia Cox
Neuroscience, BS Student

Shruti Dalvi
MS-HCI

Regan Lawson
Applied Physiology, PhD

Tae Eun Kim
Design

Udaya Lakshmi
MS-HCI

Victoria Chai
MS-HCI

Da-In Ryoo
CS, BS